
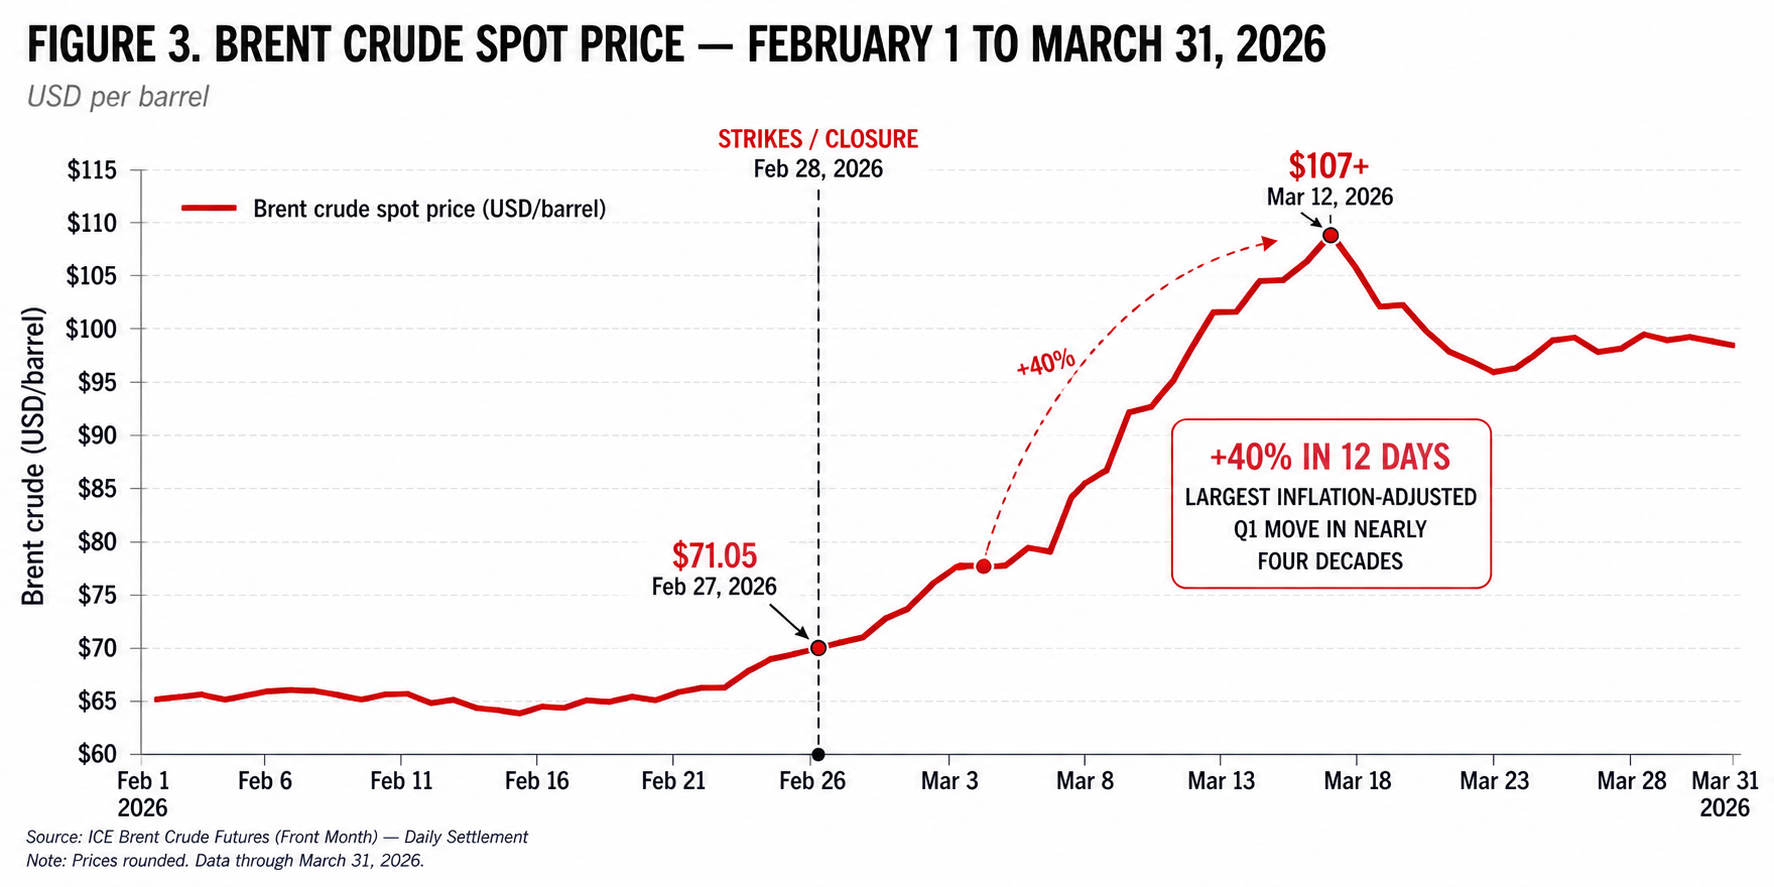
On February 28, 2026, U.S. and Israeli strikes on Iran shut the Strait of Hormuz. Within hours, tanker traffic ceased. Brent crude climbed from $71 to over $107 in twelve days. Six Gulf producers shut in 7.5 million barrels per day as onshore storage filled. The International Energy Agency triggered its largest coordinated reserve release in history at 400 million barrels. What followed was not uniform pain. It was a brutal redistribution.
This was not the first time the world rehearsed for this scenario. The Iran-Iraq tanker war of the 1980s drew the U.S. Navy into the Gulf to reflag and escort Kuwaiti tankers. Houthi drone strikes on Abqaiq in 2019 took 5.7 million barrels per day offline in a single morning. Saudi Arabia and the UAE built bypass pipelines specifically because they assumed this day would come. When it came, the infrastructure they built was not enough, and the countries that needed it most had no access to it.
The chokepoint
The Strait of Hormuz is not just the world's most important oil chokepoint. It is the most important by a wide margin. In the first half of 2025, 20.9 million barrels per day moved through a 21-nautical-mile passage between Iran and Oman. That is nearly double the volume of the Suez Canal and the SUMED Pipeline combined. It represents one fifth of global petroleum consumption and one quarter of all seaborne crude trade.
The crude moving through Hormuz comes overwhelmingly from six countries: Saudi Arabia, Iraq, the UAE, Iran, Kuwait, and Qatar. Together they account for 93 percent of the flow. On the receiving end, 89 percent goes to Asia. China alone takes 5.4 million barrels per day. India, South Korea, and Japan absorb most of the rest. Europe receives 4 percent. The United States, just 3, the result of the shale revolution and a long decline in American Persian Gulf dependence.
This concentration is the failure point. When the strait closes, the impact does not distribute evenly. The countries most dependent on Hormuz oil are not the same countries best equipped to absorb the shock.
Exposure is not vulnerability
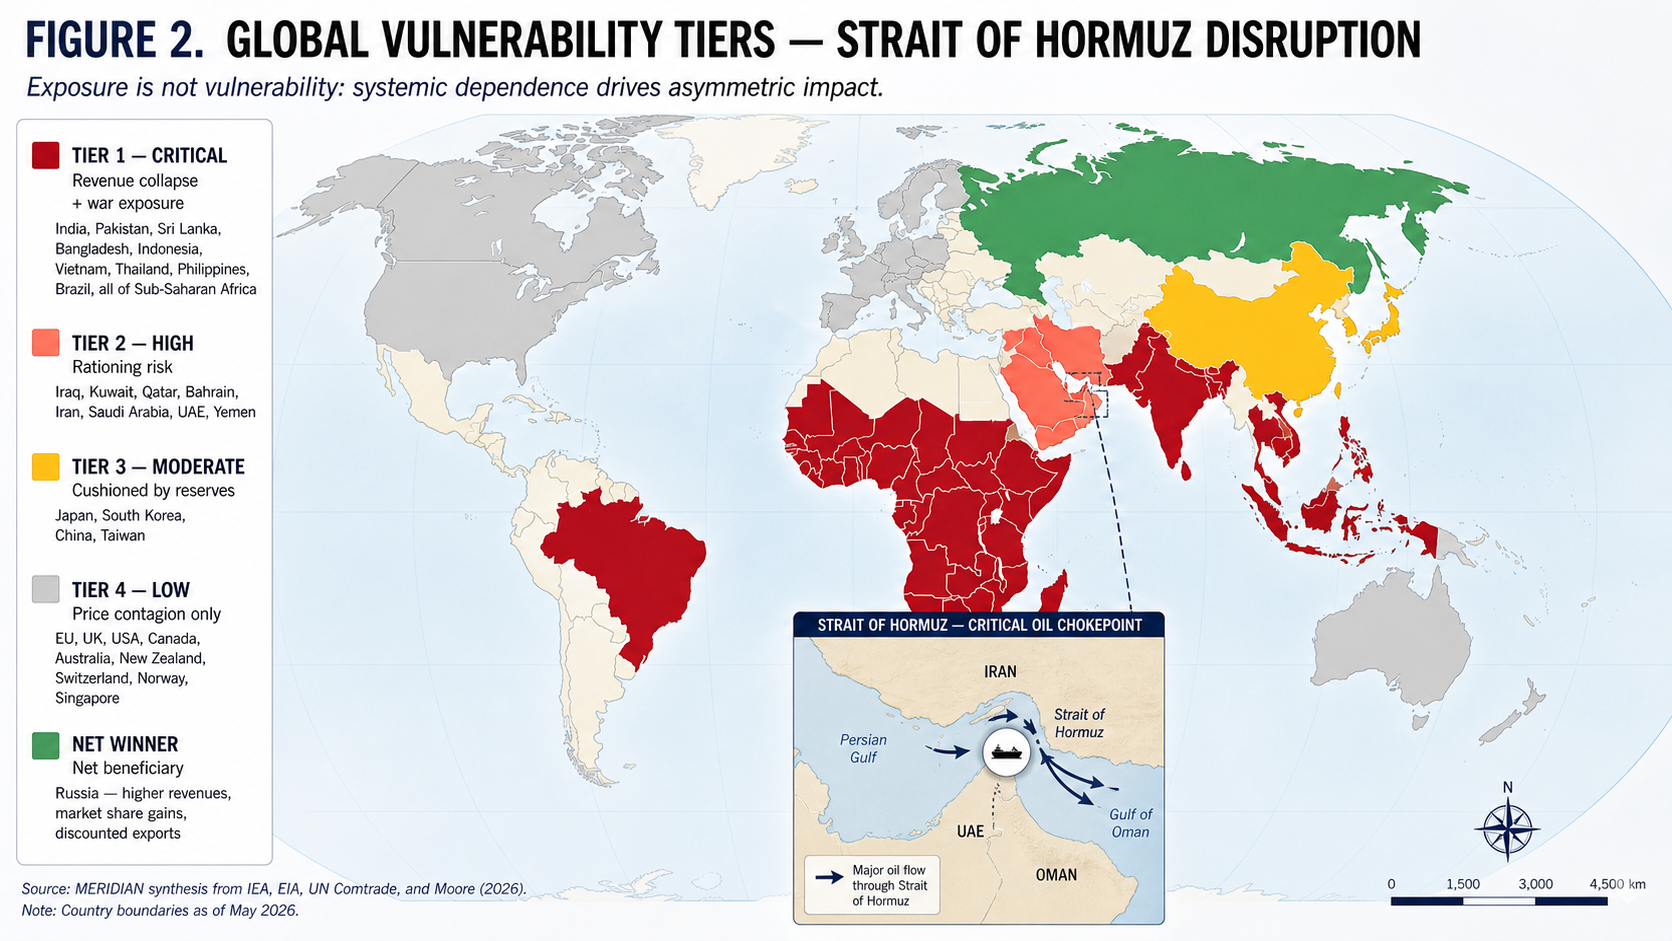
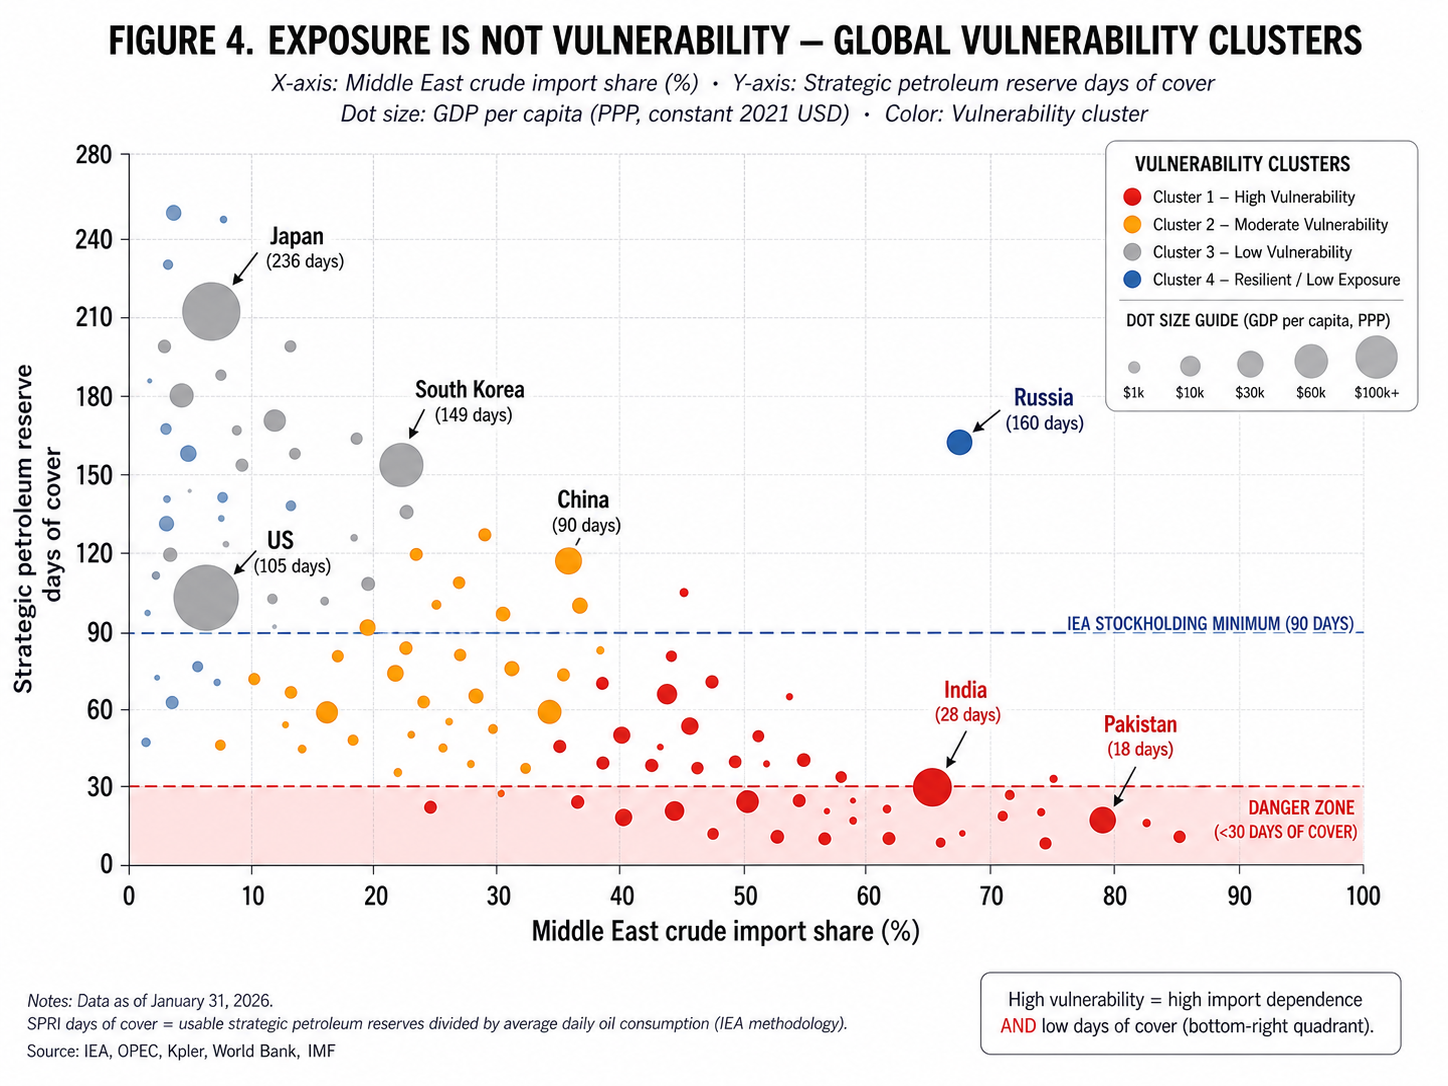
MERIDIAN's vulnerability assessment combines four normalized variables: Hormuz exposure share, strategic petroleum reserve days of cover, oil import dependency, and GDP per capita as a proxy for the economic capacity to absorb a price shock. Multivariate clustering across the 37 countries with complete data identifies four distinct profiles.
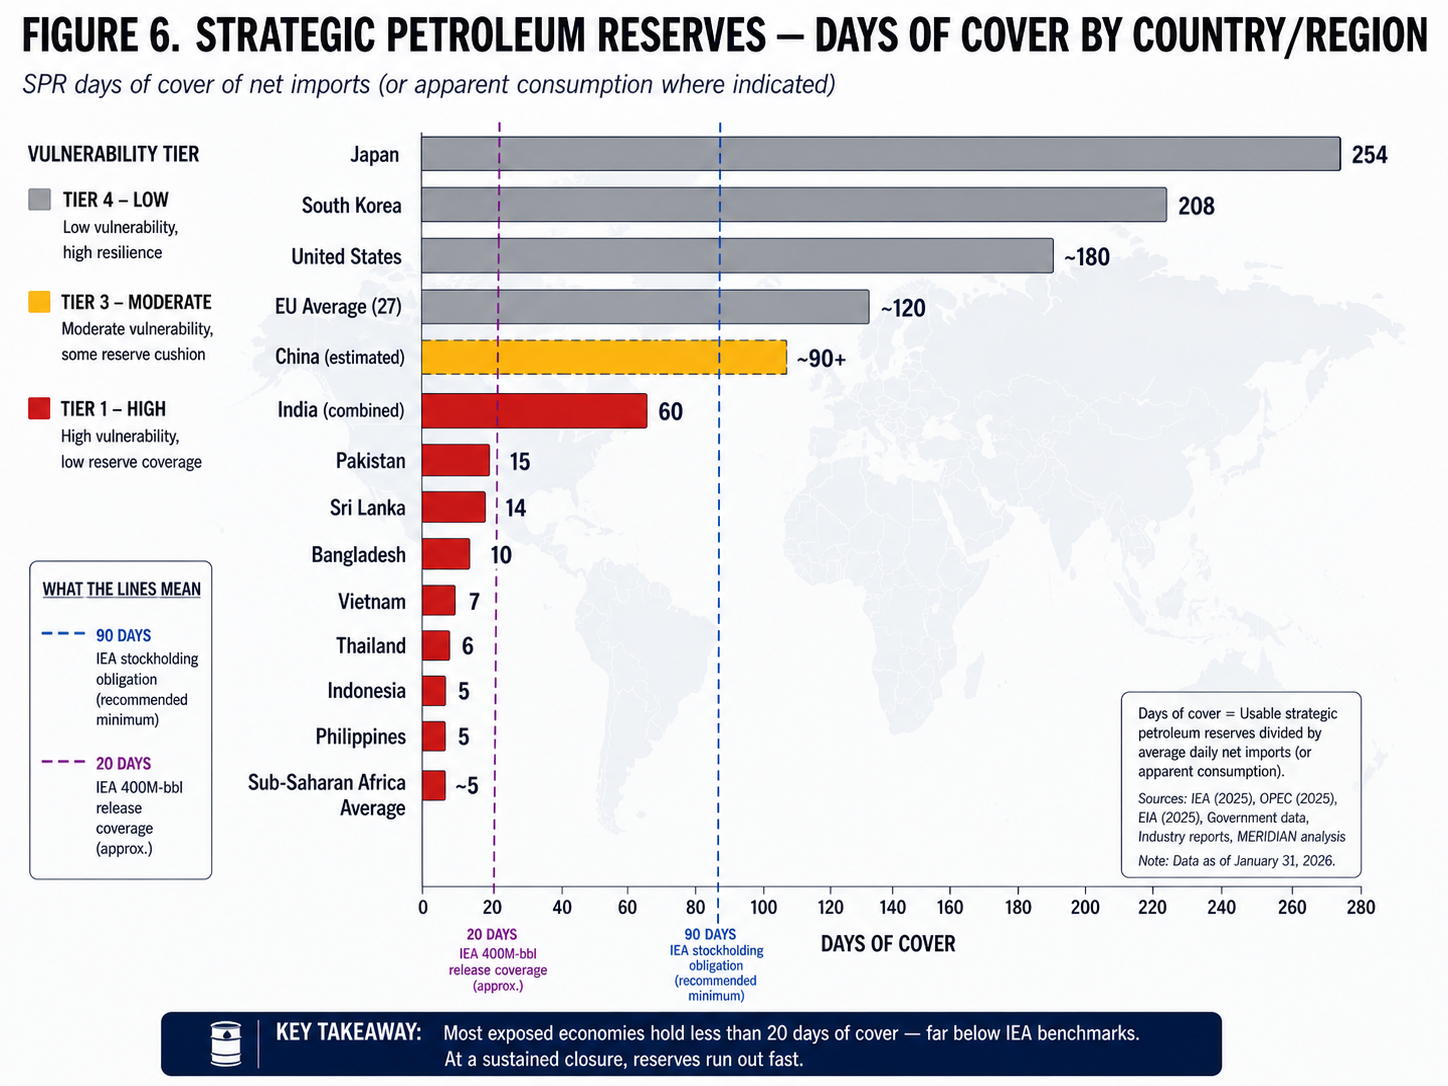
The Most Vulnerable. Eight economies including India, Pakistan, Sri Lanka, the Philippines, Vietnam, Thailand, Indonesia, and a handful of Western Hemisphere outliers like Brazil with high crude import dependence despite geographic distance. Average Middle East import share: 56 percent. Average reserves: 9 days. Average GDP per capita: $5,200. These countries face physical fuel rationing, not just price inflation. They have no buffer and no fiscal capacity to import their way through.
Highly Exposed but Resilient. Japan and South Korea. They depend on Middle East oil for 95 and 71 percent of consumption respectively, but they hold 254 and 208 days of strategic reserves. They entered the crisis more exposed than any other major economy and better prepared than almost anyone. The lesson is structural: exposure measures how much you import. Vulnerability measures whether you can survive losing it.
Moderate Exposure, IEA Compliant. Sixteen countries including most of the European Union, the United Kingdom, and China. Middle East exposure averages 12 percent, reserves cluster around the 90-day IEA minimum, and GDP per capita averages $41,000. China's classification reflects deliberate strategic reserve buildout over the last decade. The result is the IEA framework operating as designed.
Low Exposure, High Resilience. Eleven countries including the United States, Canada, Australia, Switzerland, Ireland, Norway, and Singapore. Under 10 percent Middle East exposure, GDP per capita near $79,000, deep reserves where applicable. They have the most latitude to absorb disruption and the least reason to need it.
The geography of vulnerability is not the geography of volume. China receives the largest absolute share of Hormuz crude but clusters with Europe in resilience. Japan and South Korea look more exposed than anyone but their reserves buffer the shock. The countries facing the worst structural risk are smaller South and Southeast Asian economies and Sub-Saharan African states with thin reserves and weak currencies. Proximity to the strait is not predictive of suffering.
The price shock
The crisis registered first in price. Brent crude opened at $71.05 on February 27, 2026. Twelve days later, on March 12, it closed above $107. That 40-percent move was the largest inflation-adjusted Q1 oil price increase in nearly four decades, surpassing the early-1991 Gulf War spike on a real basis. The market priced in not only the immediate shutdown of 20 million barrels per day of transit, but the absence of any plausible near-term path to normal operation while strikes continued.
The bypass falls short
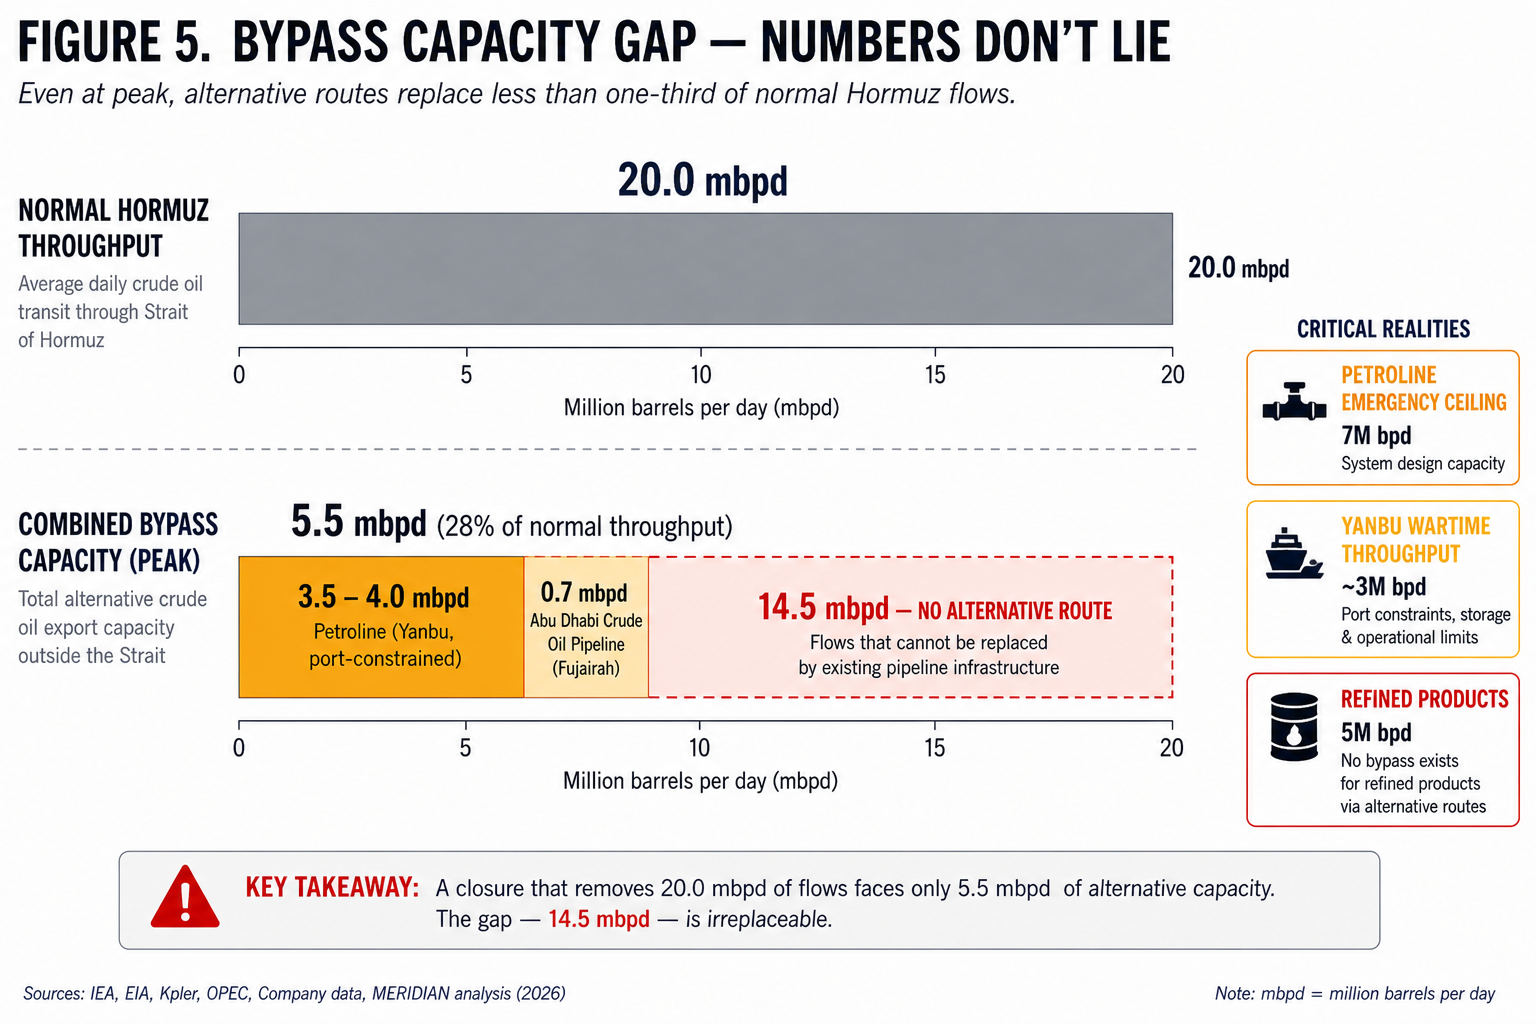
Two pipeline systems exist to route Gulf crude around the strait. Both were built decades ago for exactly this scenario.
Saudi Arabia's East-West Pipeline, the Petroline, runs 1,200 kilometers from the Abqaiq processing complex to Yanbu on the Red Sea. Its original capacity was 5 million barrels per day. After the 2019 Abqaiq strikes, Aramco converted parallel natural gas liquids lines to carry crude and raised the emergency ceiling to 7 million barrels per day. That ceiling was reached for the first time in history on March 11, 2026. The UAE's Abu Dhabi Crude Oil Pipeline carries another 1.8 million barrels per day to Fujairah, outside the strait, with about 700,000 barrels of spare capacity.
Combined, the two systems offer 3.5 to 5.5 million barrels per day of bypass against the 20 million that normally transit the strait. At best, 25 to 30 percent of the flow.
That figure overstates what actually moved. The binding constraint is not pipeline capacity. It is port throughput at Yanbu. The two terminals there have a tested loading capacity of 4 million barrels per day. Under wartime conditions, effective capacity sits closer to 3 million. In March 2026, Yanbu handled 47 Very Large Crude Carrier loadings, four times its pre-war monthly average, straining storage tanks, pilot boats, mooring crews, and berth scheduling to the limit.
There is also a second gap the bypass cannot address. The pipelines carry crude. The 5 million barrels per day of refined products that Gulf coast refineries normally export through the strait, including diesel, jet fuel, naphtha, and LPG, have no pipeline alternative. They can leave only by sea. The sea route is closed. Europe, which depends on the Persian Gulf for 30 percent of its diesel and 50 percent of its jet fuel imports, lost that supply entirely. Developing Asian buyers competing for the same refined product pool found themselves bidding against European utilities and airlines for shrinking volumes.
The bypass is a pressure valve. It is not a solution. It preserved a fraction of Saudi crude exports and prevented total supply blackout, but it could not replace the volume, the product mix, or the geographic reach of the strait it was designed to circumvent.
The reserves run out
When supply disruption of this scale occurs, governments draw on strategic petroleum reserves. The question has never been whether reserves exist. The question is how long they last when distributed across 89 percent of the world that needs them.
The IEA coordinated 400 million barrels of emergency releases in March 2026, the largest in its history. The United States authorized a draw from the Strategic Petroleum Reserve, the world's largest government stockpile. Japan, South Korea, and European IEA members followed with coordinated drawdowns. India, an IEA Association country since 2017 but not bound by the 90-day stockholding obligation, opted out of the coordinated release.
Reserve endurance varies sharply. Japan and South Korea hold over 200 days each. The United States entered the crisis with the deepest absolute buffer but limited direct exposure, making its reserve effectively a backstop for allied consumers rather than a domestic shield. China's stockpile is a state secret, with credible estimates placing it above 90 days of crude cover plus undisclosed commercial inventories. India's strategic reserve covers 9 to 12 days of net imports, supplemented by commercial stocks bringing the total to roughly 60 days. Pakistan, Sri Lanka, Bangladesh, Vietnam, Thailand, the Philippines, Indonesia, and most of Sub-Saharan Africa hold reserves measured in single digits or none at all.
The 400 million barrels released by the IEA sound enormous in isolation. Distributed across the countries that depend on Hormuz oil, they cover roughly 20 days of the supply gap. Every day past that window narrows the margin between managed disruption and genuine shortage.
Russia wins
Standard chokepoint vulnerability frameworks measure only physical supply exposure. By that frame, Russia does not appear in the analysis. By any other frame, Russia is the crisis's clearest beneficiary.
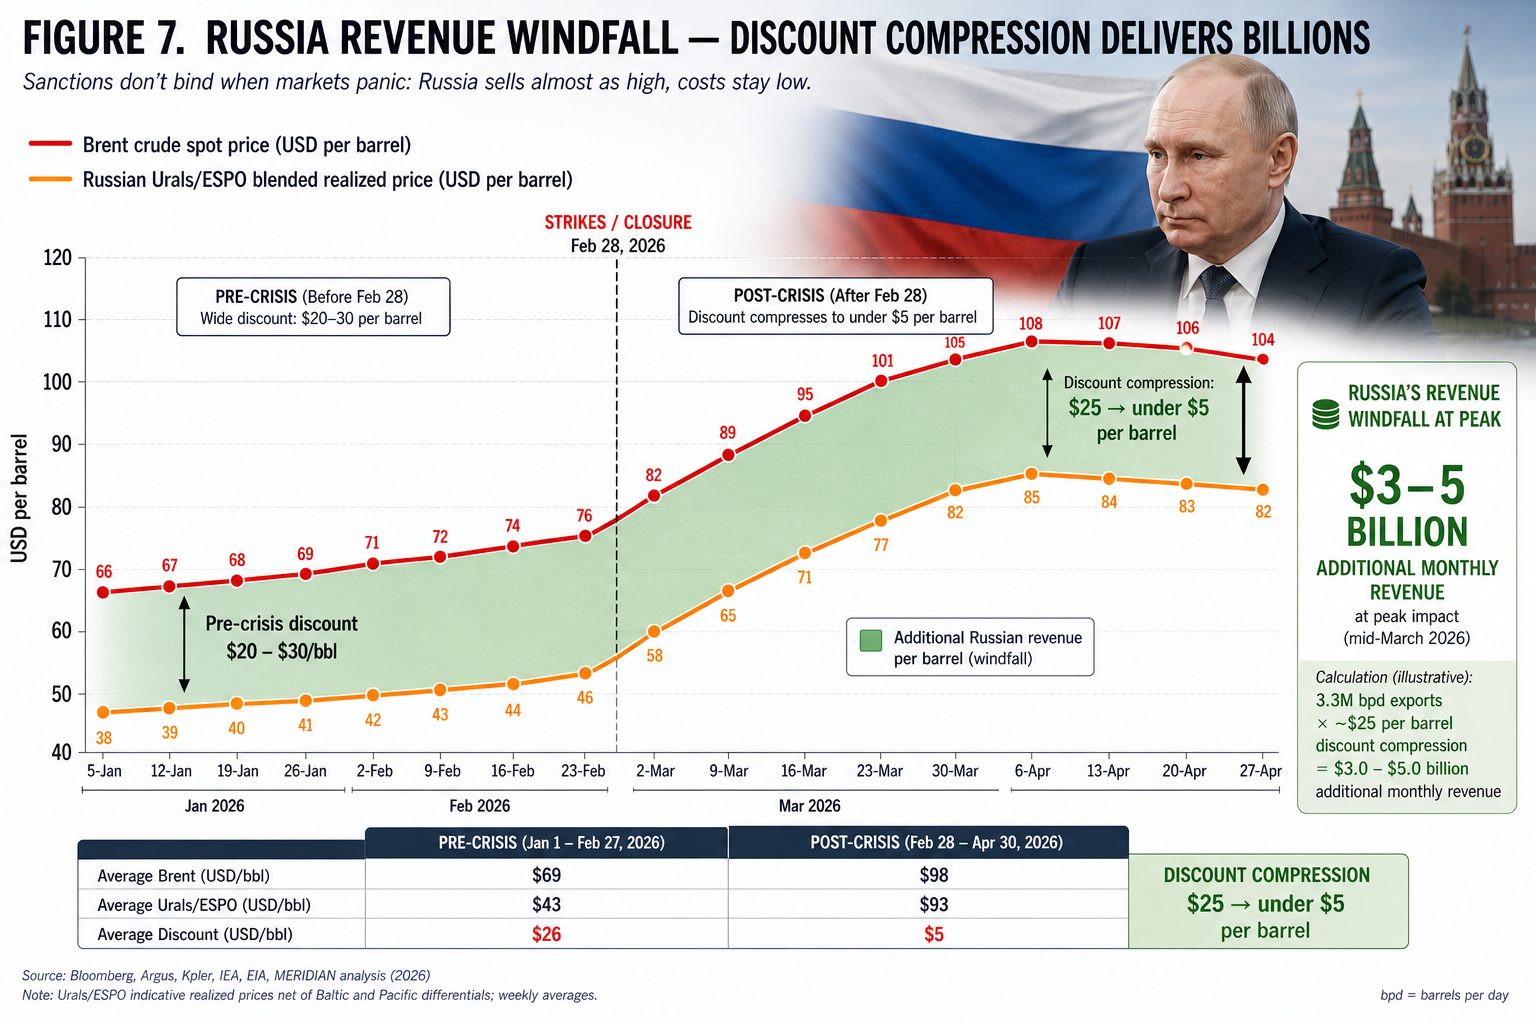
Pre-crisis, Russia sold sanctioned Urals and ESPO crude to China and India at discounts of $20 to $30 below Brent, constrained by a Western-imposed price cap that the G7 spent two years constructing. When Hormuz closed, the cap evaporated economically. Buyers needed barrels more than they needed compliance.
The price story made Russia rich on three fronts simultaneously. Brent doubled, so every Russian barrel earned more revenue at the headline rate. The discount Russia accepted compressed sharply, with Urals and ESPO moving from $20 to $30 below Brent toward near parity as Asian buyers bid against each other for spare supply. And Russia's pipeline routes to China through the ESPO system, operational since 2009 and expanded in 2018, were already in place, requiring no new infrastructure to capture additional volume.
At Russian seaborne export levels of roughly 3.3 million barrels per day, the combination of Brent appreciation and discount narrowing translated into an additional $3 to $5 billion in monthly revenue at peak. The wartime Russian economy received a windfall at the precise moment Western sanctions were beginning to bite. Two years of price cap engineering was neutralized in twelve days.
The omission of Russia from public chokepoint analysis is not an accident. It reflects an assumption baked into the standard framework: that vulnerability is about losing supply. The 2026 crisis demonstrates that complete vulnerability analysis must account for who gains, because the redistribution of leverage is itself a strategic outcome. MERIDIAN's analytical methodology incorporates beneficiary analysis as a core layer. Standard frameworks do not.
"The country that triggered the crisis is the only one not running out of fuel."
Who paid, who didn't
Synthesizing physical exposure, reserve adequacy, the refined product gap, and beneficiary effects yields a ranked impact across all major actors.
The most severe pain falls on developing Asia. India, Pakistan, Sri Lanka, Indonesia, Vietnam, Thailand, and the Philippines combine high Hormuz dependence, thin reserves, weak fiscal space, and currencies that cannot absorb a doubled fuel import bill. Sub-Saharan Africa faces the same dynamics with even less data and even thinner buffers. These economies face physical rationing and political destabilization, not just price inflation.
Below them, the Gulf producers without bypass routes. Iraq, Kuwait, Qatar, and Bahrain face revenue collapse layered on top of war exposure. Iran, the strategic actor whose response triggered the closure, suffers the same revenue collapse without the option to exploit the price spike its own actions created. Iran's strategic position, often described as strengthened by chokepoint leverage, is in fact weaker after the crisis than before it.
In the middle tier, Japan and South Korea are exposed proportionally more than anyone else but cushioned by world-class reserves. China takes the largest absolute volume hit but its reserve depth, supply diversification, and macroeconomic capacity absorb the shock at the policy level even as refining margins crater.
At the bottom of the suffering scale: the European Union, severed from Persian Gulf diesel and jet fuel but with diversified crude supply and IEA backstop. The United States faces price contagion through global benchmark pricing but no physical shortage at any pump. The country with the largest petroleum production on earth and only 3 percent direct Hormuz exposure also happens to be the country whose strikes started the crisis.
The lone net winner is Russia, and the country that triggered the crisis is the only one not running out of fuel.
- Brent crude rose 40 percent in twelve days, from $71 on February 27 to over $107 by mid-March, the largest inflation-adjusted Q1 oil price move in nearly four decades.
- Eight South and Southeast Asian economies and the entirety of Sub-Saharan Africa face physical fuel rationing, not just price inflation, due to the combination of Hormuz dependence, minimal strategic reserves, and limited fiscal capacity to absorb the shock.
- Bypass pipeline capacity covers at most 25 to 30 percent of normal Hormuz flow and is further constrained by port throughput limits at Yanbu. The infrastructure built for this scenario was insufficient when the scenario arrived.
- Refined products including diesel and jet fuel have no pipeline alternative at all. Europe lost approximately 30 percent of diesel imports and 50 percent of jet fuel imports overnight. The refined product gap is the sleeper crisis inside the headline crisis.
- Russia, absent from standard chokepoint vulnerability frameworks, is the crisis's clearest beneficiary. The combination of Brent appreciation and discount compression on sanctioned grades generated an estimated $3 to $5 billion in additional monthly revenue at peak, neutralizing two years of Western price cap engineering in twelve days.
What comes next
The Hormuz crisis exposes structural realities that will reshape energy geopolitics regardless of when the strait reopens.
Asia's strategic posture changes permanently. The Asian importers who survived the crisis on reserves will rebuild them aggressively. Japan and South Korea will deepen what was already the world's most sophisticated stockholding regime. China's reserve program, already opaque, will accelerate. India, which opted out of the IEA release, will face domestic pressure to build genuine strategic capacity rather than relying on commercial inventories. The political memory of fuel rationing in South and Southeast Asia will outlast the crisis itself, and it will manifest as a generational supply diversification away from Persian Gulf dependence.
The supply pivot benefits Russia, West Africa, and Latin America, not the Gulf. Asian buyers who spent March 2026 scrambling for non-Hormuz crude have already begun signing long-term contracts with Russian, Angolan, Brazilian, and Guyanese suppliers. The Gulf producers, even after the strait reopens, will face structurally lower premium pricing into Asian markets. The ESPO pipeline running east into China will likely see capacity expansion. The Russia-to-Asia energy corridor, accelerated by sanctions in 2022 and now further entrenched by 2026, is the single most consequential structural shift the crisis produced.
Iran emerges weaker, not stronger. The conventional wisdom that Iran derives strategic leverage from its ability to threaten Hormuz has always assumed Iran could profit from the disruption it causes. The 2026 crisis demonstrates the opposite. Iran's barrels were bottled up alongside everyone else's. Its revenue collapsed at the same moment Russian revenue surged. The chokepoint card, played, is a card spent. Tehran will not be eager to play it again, and the Gulf producers it threatens have a renewed strategic case for further bypass investment.
The U.S. faces a price-transmission problem it has been ignoring for a decade. Physical insulation from Hormuz disruption was the policy victory of the shale era. It is real, and it is not enough. Global benchmark pricing transmitted the shock into American gasoline, diesel, jet fuel, freight, fertilizer, and downstream inflation regardless of whether physical barrels reached U.S. refineries. Any future U.S. energy security framework that treats production capacity as equivalent to consumer protection will misread the next crisis the same way.
For analysts watching what comes next, Malacca is the obvious successor in attention. But Hormuz remains the anchor. The infrastructure failed once at scale. It will be tested again.
Vulnerability classifications derived from MERIDIAN multivariate cluster analysis of 37 countries with complete data across four normalized indicators: Middle East crude import share (UN Comtrade HS 2709, 2024), strategic petroleum reserve days of cover (IEA and national energy agencies, 2025-2026), oil import dependency (Energy Institute Statistical Review 2025), and GDP per capita as economic absorption proxy (World Bank, 2024). 205 countries excluded due to incomplete data on one or more measures.
Bypass capacity figures cross-referenced from IEA Oil Market Report (March 2026), EIA World Oil Transit Chokepoints (March 2026), and S&P Global reporting on Aramco East-West Pipeline activation (March 2026). Yanbu port throughput estimates from Vortexa via Lloyd's List and Argus Media reporting.
Russia beneficiary analysis is MERIDIAN-original, derived from analytical methodology applied to pre-crisis ESPO and Urals pricing differentials, established pipeline export capacity to China and India, sanctioned-barrel discount narrowing, and gray-market export channel monitoring. Revenue estimates use Russian seaborne export volumes near 3.3 million barrels per day, Brent appreciation of approximately $36 per barrel at peak, and discount compression from $20 to $30 below Brent toward near parity. Standard chokepoint frameworks address physical supply chain exposure only and exclude beneficiary analysis.
Confidence: HIGH on flow volumes, price movements, and IEA reserve releases (multiply-sourced, official). MODERATE on cluster boundaries (sensitive to indicator weighting choices and country data availability). MODERATE on Russia revenue figures (gray-market and sanctioned-channel data inherently incomplete).
- International Energy Agency. (2026, March 12). Oil Market Report, March 2026. iea.org/reports/oil-market-report-march-2026
- International Energy Agency. (2026, February 6). Strait of Hormuz. iea.org/about/oil-security-and-emergency-response/strait-of-hormuz
- U.S. Energy Information Administration. (2026, April 8). Crude Oil and Petroleum Product Prices Increased Sharply in the First Quarter of 2026. eia.gov/todayinenergy/detail.php?id=67424
- U.S. Energy Information Administration. (2026, March 3). World Oil Transit Chokepoints. eia.gov/international/content/analysis/special_topics/World_Oil_Transit_Chokepoints
- U.S. Energy Information Administration. (2026, April 7). Hormuz Closure and Related Production Outages Are Key Drivers in EIA's Latest Forecast. eia.gov/pressroom/releases/press586.php
- S&P Global Commodity Insights. (2026, March 10). Aramco's East-West Pipeline to Hit Full Capacity in Next Couple of Days. spglobal.com/energy/en/news-research/latest-news/crude-oil/031026
- Vortexa. (2026). Yanbu Terminal Loading Estimates and Port Capacity Analysis. Via Lloyd's List and Argus Media reporting.
- Energy Institute. (2025). Statistical Review of World Energy 2025. energyinst.org/statistical-review
- World Bank. (2026). GDP per Capita (Current US$). World Development Indicators. data.worldbank.org/indicator/NY.GDP.PCAP.CD
- United Nations Statistics Division. UN Comtrade Database, HS Commodity 2709 (Crude Petroleum), 2024. comtradeplus.un.org
- International Monetary Fund and Environmental Change Institute, University of Oxford. (2026). PortWatch: Strait of Hormuz Daily Transit Calls and Transit Trade Volume. portwatch.imf.org
- Li, E. (2026, March 9). China's Crude Import Stress Resistance in a Hormuz Crisis. Vortexa. vortexa.com/insights/chinas-crude-import-stress-resistance
- Moore, K. (2026). Chokepoint: Global Oil Supply Vulnerability and the 2026 Strait of Hormuz Crisis. ArcGIS StoryMaps.
- MERIDIAN internal tracking dataset. Russia ESPO and Urals seaborne flows, sanctioned-channel export monitoring, 2024-2026.